fairMLHealth
Healthcare-specific tools for bias analysis
Quick Reference for Fairness Measures
Fairness Metrics
Metrics by Category
There are three common categories of metrics for determining whether a model is considered “fair”: Group Fairness, which compares the statistical similarities of predictions relative to known and discrete protected groupings; Similarity-Based Measures, which evaluate predictions without those discrete protected groups; and Causal Reasoning measures, which evaluate fairness through the use of causal models.
| Category | Metric | Definition | Weakness | References |
|---|---|---|---|---|
| Group Fairness | Demographic Parity | A model has Demographic Parity if the predicted positive rates (selection rates) are approximately the same for all protected attribute groups: Harms Addressed: Allocative |
Historical biases present in the data are not addressed and may still bias the model. | Zafar et al (2017) |
| Equalized Odds | Odds are equalized if P(+) is approximately the same for all protected attribute groups. Equal Opportunity is a special case of equalized odds specifying that P(+ | y = 1) is approximately the same across groups. Harms Addressed: Allocative, Representational |
Historical biases present in the data are not addressed and may still bias the model. | Hardt et al (2016) | |
| Predictive Parity | This parity exists where the Positive Predictive Value is approximately the same for all protected attribute groups. Harms Addressed: Allocative, Representational |
Historical biases present in the data are not addressed and may still bias the model. | Zafar et al (2017) | |
| Similarity-Based Measures | Individual Fairness | Individual fairness exists if “similar” individuals (ignoring the protected attribute) are likely to have similar predictions. Harms Addressed: Representational |
The appropriate metric for similarity may be ambiguous. | Dwork (2012), Zemel (2013), Kim et al (2018) |
| Entropy-Based Indices | Measures of entropy, particularly existing inequality indices from the field of economics, are applied to evaluate either individuals or groups Harms Addressed: Representational |
Speicher (2018) | ||
| Unawareness | A model is unaware if the protected attribute is not used. Harms Addressed: Allocative, Representational |
Removal of a protected attribute may be ineffectual due to the presence of proxy features highly correlated with the protected attribute. | Zemel et al (2013), Barocas and Selbst (2016) | |
| Causal Reasoning | Counterfactual Fairness * | Counterfactual fairness exists where counterfactual replacement of the protected attribute does not significantly alter predictive performance. This counterfactual change must be propogated to correlated variables. Harms Addressed: Allocative, Representational |
It may be intractable to develop a counterfactual model. | Russell et al (2017) |
Statistical Definitions of Group Fairness
| Metric | Criteria | Definition | Description |
|---|---|---|---|
| Demographic Parity | Statistical Independence | Sensitive attributes (A) are statistically independent of the prediction result (R) | |
| Equalized Odds | Statistical Separation | Sensitive attributes (A) are statistically independent of the prediction result (R) given the ground truth (Y) | |
| Predictive Parity | Statistical Sufficiency | Sensitive attributes (A) are statistically independent of the ground truth (Y) given the prediction (R) |
From: Verma & Rubin, 2018
Fairness Measures
| Name | Definition | About | Aliases | |
|---|---|---|---|---|
| Demographic Parity | Predictions must be statistically independent from the sensitive attributes. Subjects in all groups should have equal probability of being assigned to the positive class. Note: may fail if the distribution of the ground truth justifiably differs among groups Criteria: Statistical Independence |
Statistical Parity, Equal Acceptance Rate, Benchmarking | ||
| Conditional Statistical Parity | Subjects in all groups should have equal probability of being assigned to the positive class conditional upon legitimate factors (L). Criteria: Statistical Separation |
|||
| False positive error rate (FPR) balance | Equal probabilities for subjects in the negative class to have positive predictions. Mathematically equivalent to equal TNR: Criteria: Statistical Separation |
Predictive Equality | ||
| False negative error rate (FNR) balance | Equal probabilities for subjects in the positive class to have negative predictions. Mathematically equivalent to equal TPR: Criteria: Statistical Separation |
Equal Opportunity | ||
| Equalized Odds | Equal TPR and equal FPR. Mathematically equivalent to the conjunction of FPR balance and FNR balance Criteria: Statistical Separation |
Disparate mistreatment, Conditional procedure accuracy equality | ||
| Predictive Parity | All groups have equal PPV (probability that a subject with a positive prediction actually belongs to the positive class. Mathematically equivalent to equal False Discovery Rate (FDR): Criteria: Statistical Sufficiency |
Outcome Test | ||
| Conditional use accuracy equality | Criteria: Statistical Sufficiency | |||
| Overall Accuracy Equity | Use when True Negatives are as desirable as True Positives | |||
| Treatment Equality | Groups have equal ratios of False Negative Rates to False Positive Rates | |||
| Calibration | For a predicted probability score S, both groups should have equal probability of belonging to the positive class Criteria: Statistical Sufficiency |
Test-fairness, matching conditional frequencies | ||
| Well-calibration | For a predicted probability score S, both groups should have equal probability of belonging to the positive class, and this probability is equal to S Criteria: Statistical Sufficiency |
|||
| Balance for positive class | Subjects in the positive class for all groups have equal average predicted probability score S Criteria: Statistical Separation |
|||
| Balance for negative class | Subjects in the negative class for all groups have equal average predicted probability score S Criteria: Statistical Separation |
|||
| Causal discrimination | Same classification produced for any two subjects with the exact same attributes | |||
| Fairness through unawareness | No sensitive attributes are explicitly used in the decision-making process Criteria: Unawareness |
|||
| Fairness through awareness (Individual Fairness) | for a set of applicants V , a distance metric between applicants k : V Å~V → R, a mapping from a set of applicants to probability distributions over outcomes M : V → δA, and a distance D metric between distribution of outputs, fairness is achieved iff |
Similar individuals (as defined by some distance metric) should have similar classification | Individual Fairness | |
| Counterfactual fairness | A causal graph is counterfactually fair if the predicted outcome d in the graph does not depend on a descendant of the protected attribute G. | |||
Interpretation of Common Measures
| Group Measure Type | Examples | “Fair” Range |
|---|---|---|
| Statistical Ratio | Disparate Impact Ratio, Equalized Odds Ratio | 0.8 <= “Fair” <= 1.2 |
| Statistical Difference (Binary Classification) | Equalized Odds Difference, Predictive Parity Difference | -0.1 <= “Fair” <= 0.1 |
| Statistical Difference (Regression) | MAE Difference, Mean Prediction Difference | Problem Specific |
| Metric | Measure | Equation | Interpretation |
|---|---|---|---|
| Group Fairness Measures - Binary Classification | Selection Rate | - | |
| Demographic (Statistical) Parity Difference | (-) favors privileged group (+) favors unprivileged group |
||
| Disparate Impact Ratio (Demographic Parity Ratio) | < 1 favors privileged group > 1 favors unprivileged group |
||
| Positive Rate Difference | (-) favors privileged group (+) favors unprivileged group |
||
| Average Odds Difference | (-) favors privileged group (+) favors unprivileged group |
||
| Average Odds Error | (-) favors privileged group (+) favors unprivileged group |
||
| Equal Opportunity Difference | (-) favors privileged group (+) favors unprivileged group |
||
| Equal Odds Difference | (-) favors privileged group (+) favors unprivileged group |
||
| Equal Odds Ratio | < 1 favors privileged group > 1 favors unprivileged group |
||
| Group Fairness Measures - Regression | Mean Prediction Ratio | < 1 favors privileged group > 1 favors unprivileged group |
|
| Mean Prediction Difference | (-) favors privileged group (+) favors unprivileged group |
||
| MAE Ratio | < 1 favors privileged group > 1 favors unprivileged group |
||
| MAE Difference | (-) favors privileged group (+) favors unprivileged group |
||
| Individual Fairness Measures | Consistency Score | 1 is consistent 0 is inconsistent |
|
| Generalized Entropy Index | 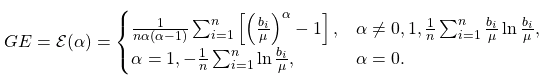 |
- | |
| Generalized Entropy Error | - | ||
| Between-Group Generalized Entropy Error | 0 is fair (+) is unfair |
References
Agarwal, A., Beygelzimer, A., Dudík, M., Langford, J., & Wallach, H. (2018). A reductions approach to fair classification. In International Conference on Machine Learning (pp. 60-69). PMLR. Available through arXiv preprint:1803.02453.
Barocas, S., & Selbst AD (201). Big data’s disparate impact. California Law Review, 104, 671. Retrieved from https://www.cs.yale.edu/homes/jf/BarocasDisparateImpact.pdf
Dwork, C., Hardt, M., Pitassi, T., Reingold, O., & Zemel, R. (2012, January). Fairness through awareness. In Proceedings of the 3rd innovations in theoretical computer science conference (pp. 214-226). Retrieved from https://arxiv.org/pdf/1104.3913.pdf
Hardt, M., Price, E., & Srebro, N. (2016). Equality of opportunity in supervised learning. In Advances in neural information processing systems (pp. 3315-3323). Retrieved from http://papers.nips.cc/paper/6374-equality-of-opportunity-in-supervised-learning.pdf
Kim, M., Reingol, O., & Rothblum, G. (2018). Fairness through computationally-bounded awareness. In Advances in Neural Information Processing Systems pp. 4842-4852). Retrieved from https://arxiv.org/pdf/1803.03239.pdf
Russell, C., Kusner, M.J., Loftus, J., & Silva, R. (2017). When worlds collide: integrating different counterfactual assumptions in fairness. In Advances in Neural Information Processing Systems (pp. 6414-6423). Retrieved from https://papers.nips.cc/paper/7220-when-worlds-collide-integrating-different-counterfactual-assumptions-in-fairness.pdf
Verma, S., & Rubin, J. (2018, May). Fairness definitions explained. In 2018 ieee/acm international workshop on software fairness (fairware) (pp. 1-7). IEEE.
Zemel, R., Wu, Y., Swersky, K., Pitassi, T., & Dwork, C. (2013, February). Learning fair representations. International Conference on Machine Learning (pp. 325-333). Retrieved from http://proceedings.mlr.press/v28/zemel13.pdf
Zafar, M.B., Valera, I., Gomez Rodriguez, M., & Gummadi, K.P. (2017, April). Fairness beyond disparate treatment & disparate impact: Learning classification without disparate mistreatment. In Proceedings of the 26th international conference on world wide web (pp. 1171-1180). https://arxiv.org/pdf/1610.08452.pdf